
Johan Vromans
|
Home Assistant, Grafana and Postgres
This article requires same basic knowledge of using Grafana.
Grafana is a powerful tool for graphical representation of data. It is an excellent tool to visualize and analyze Home Assistant statistics.
To use Grafana, Home Assistant advices to use Influx as a recorder since this neatly integrates with Grafana. However, this is not neccesary since Grafana can deal with many other data sources as well.
In my setup, I have used a PostgreSQL database running on an external database server from the very first moment I started using Home Assistant. There were a couple of reasons for this decision:
My initial Home Assistant was running on a Raspberry Pi with SD card, and SD cards tend to wear out fast with the intensive storage operations that result from a database.
I wanted to use custom tools to analyze and maybe adjust the data in the database. SQLite is not really suitable for concurrent access and updating.
I am an experienced PostgreSQL user.
In the mean time much has improved on the side of Home Assistant and the way it uses the database, and my system is now running on a thin client with SSD. When starting again I probably would not switch to an external database, but I see no reason to go through the hassle of migrating back to the SQLite database.
Connecting Grafana with the PostgreSQL database
Assuming you have successfully installed Grafana, the first thing that is required is adding the PostgreSQL database as a datasource.
Settings > Datasources will show a list of available datasources. Press ‘Add Datasource’ and select PostgreSQL. Give your datasource a name, e.g. “hass” and fill in the connection details ‘host’, ‘database’, ‘user’ and ‘password’. Press ‘Save & Test’, this will also verify if the connection was properly set up.
Creating Grafana queries
In Grafana panels the graphs are created from data retrieved from
the database using SQL queries. Home Assistant stores the entity
states in table states, and the entity ids are in table
states_meta. A generic state query for a particular
entity, e.g., sensor.thermostat_hc1_currtemp looks like
(line numbers for reference only):
SELECT last_updated_ts as "time",state::decimal as "temperatuur"FROM statesWHERE $__unixEpochFilter(last_updated_ts)AND metadata_id = ( SELECT metadata_idFROM states_metaWHERE entity_id = 'sensor.thermostat_hc1_currtemp' )AND state !~ 'un(available|known)'ORDER BY 1
The running time is in the
last_updated_tscolumn. It is a double precision number wich is suitable for Grafana.The state is in the
statecolumn. It is a text value, so it must be interpreted (converted) as numeric.States are selected from the
statestable.First selection is on the time range. Grafana provides a handy macro
$__unixEpochFilterthat selects the current time range for the dashboard.The second selection is on the entity. Entities are identified by their
metadata_ids, that is key to thestates_metatable. This table maps themetadata_idto theentity_id. We use a nested query.States in the database may occasionally be “unknown“ or “unavailable”. This will yield a conversion error. To prevent this, add an additional selection.
Sort (ascending) on the first column.
Looking at this query from a distance we see that it is all fixed
code except for two items: the name of the entity,
sensor.thermostat_hc1_currtemp, and the name used in
Grafana, temperatuur. Queries for other entities can be
copies from this one, just adjust these two items.
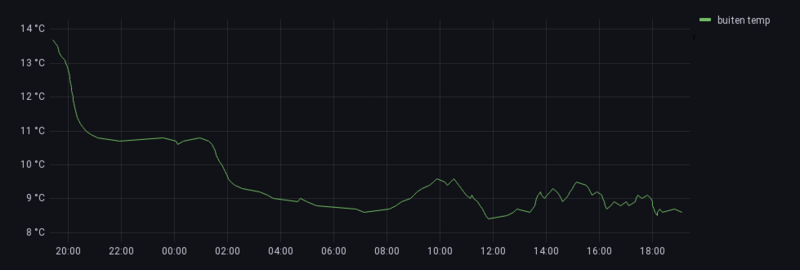
Common graphs with data points
SELECTlast_updated_ts as "time",state ::decimal as "buiten temp"FROM statesWHERE $__unixEpochFilter(last_updated_ts)AND metadata_id = ( SELECT metadata_id FROM states_meta WHERE entity_id = 'sensor.buiten_temperature' )ORDER BY 1
The graph is a time series graph, the style is lines, linear, no gradient, no points.
State values
While Grafana is very strong at drawing graphs from points, there is one thing severely lacking, at least in my opinion: support to represent states.
For example, when trying to show the setting of the thermostat.
SELECT last_updated_ts as "time",state::decimal as "thermostaat"FROM statesWHERE $__unixEpochFilter(last_updated_ts)AND metadata_id = ( SELECT metadata_id FROM states_meta WHERE entity_id = 'number.thermostat_hc1_seltemp' )AND state !~ 'un(available|known)'ORDER BY 1
The graph is a time series graph, the style is lines, step after, no gradient, no points.
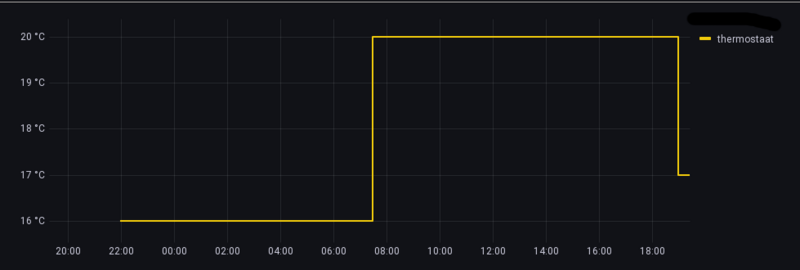
At first sight this looks okay. But wait! The thermostat switched to 16°C at 22:00 hours, but the setting before 22:00 is not shown.
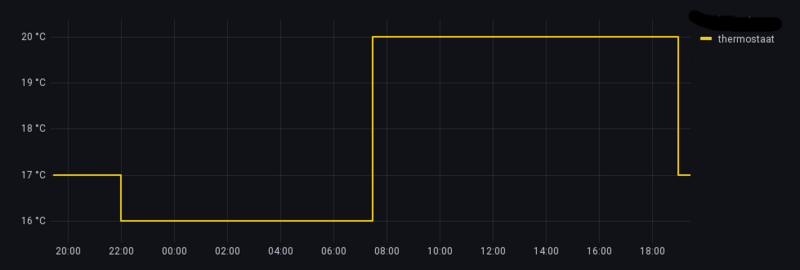
Technically speaking, at least that is the official point of view of the Grafana team, this is correct: the graph starts at the first value point. But I think for this type of graphs it is not the point that matters, but the value. So it is much more intuitive to carry over the previous value. Fortunately we can achieve that by adding an additional query that adds a value point at the start time of the graph:
SELECT last_updated_ts as "time",state::decimal as "thermostaat"FROM statesWHERE $__unixEpochFilter(last_updated_ts)AND metadata_id = ( SELECT metadata_id FROM states_meta WHERE entity_id = 'number.thermostat_hc1_seltemp' )AND state !~ 'un(available|known)'UNION(SELECT$__from,state ::decimal AS "thermostaat"FROM statesWHEREmetadata_id = ( SELECT metadata_id FROM states_meta WHERE entity_id = 'number.thermostat_hc1_seltemp' )AND last_updated_ts < $__fromAND state !~ 'un(available|known)'ORDER BY last_updated_ts DESC LIMIT 1)ORDER BY 1
The second select retrieves the last value before the start of the
graph (note the convenient use of the predefined macro
$__from) and adds it precisely at the start. The graph
now looks as intended: the value at 20:00 is 17°C, no matter when
in the past it was set.
You can apply the same method to have Grafana draw a horizontal line between the last value point and the current time.
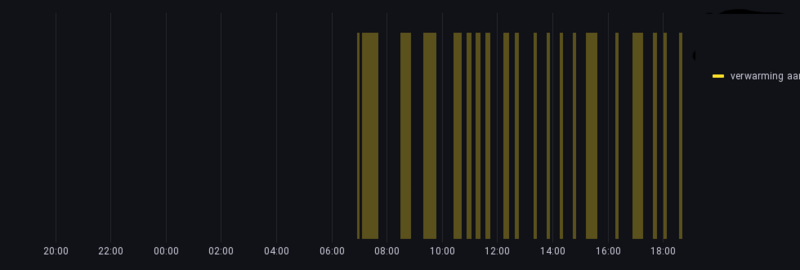
Using fills for binary sensors
Another nice thing is to abuse the fill opacity that Grafana can add to graphs. I use this to show the state of a binary sensor by shading the corresponding parts of the graph.
SELECTlast_updated_ts as "time",CASE state WHEN 'on' THEN 1 ELSE 0 END as "verwarming aan"FROM statesWHERE $__unixEpochFilter(last_updated_ts)AND metadata_id = ( SELECT metadata_id FROM states_meta WHERE entity_id = 'binary_sensor.boiler_heatingactive' )AND state !~ 'un(available|known)'UNION(SELECT$_from as "time",CASE state WHEN 'on' THEN 1 ELSE 0 END as "verwarming aan"FROM statesWHEREmetadata_id = ( SELECT metadata_id FROM states_meta WHERE entity_id = 'binary_sensor.boiler_heatingactive' )AND state !~ 'un(available|known)'ORDER BY last_updated_ts DESC LIMIT 1)UNION(SELECTdate_part('epoch',now()) as "time",CASE state WHEN 'on' THEN 1 ELSE 0 END as "verwarming aan"FROM statesWHEREmetadata_id = ( SELECT metadata_id FROM states_meta WHERE entity_id = 'binary_sensor.boiler_heatingactive' )AND state !~ 'un(available|known)'ORDER BY last_updated_ts DESC LIMIT 1)ORDER BY 1
Lines 1 - 6 select the state of the sensor, either on
or off, and maps this to the numeric values 1 or 0. Lines
8 - 14 add a value point at the start of the graph, and lines 16 - 22
add a value point at the current time. The graph is a time series
graph, the style is lines, step after, fill opacity 30, no gradient,
no points, vertical axis is hidden.
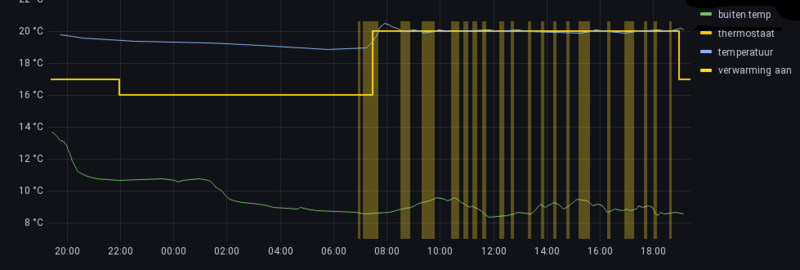
Everything combined
The unit of measurement of all temperatures is °C so they nicely combine with a common Y axis. The unit of measurement of the binary sensor is different and therefore Grafana gives it its own axis. Since we're not interested in the values, only in the state, we hide this axis.
The graph shows the outside (“buiten temp”) and inside temperatures, the setting of the thermostat, and when the heating is active.
Click here for an export file with this panel, suitable for importing in your Grafana.
I have a self-learning thermostat and you can see in the graph that the heating becomes active half an hour before the thermostat switches to day temperature, in an attempt to reach the target temperature at switch time. This works nicely most of the time.
© Copyright 2003-2023 Johan Vromans. All Rights Reserved.
articles/hass_grafana/index.html last modified 08:02:36 25-Apr-2023